
Measure the environment your people actually work in.
Six connected lenses, read as one system. See the gap between what leadership assumes and what people experience, and what's causing it.
What we measure
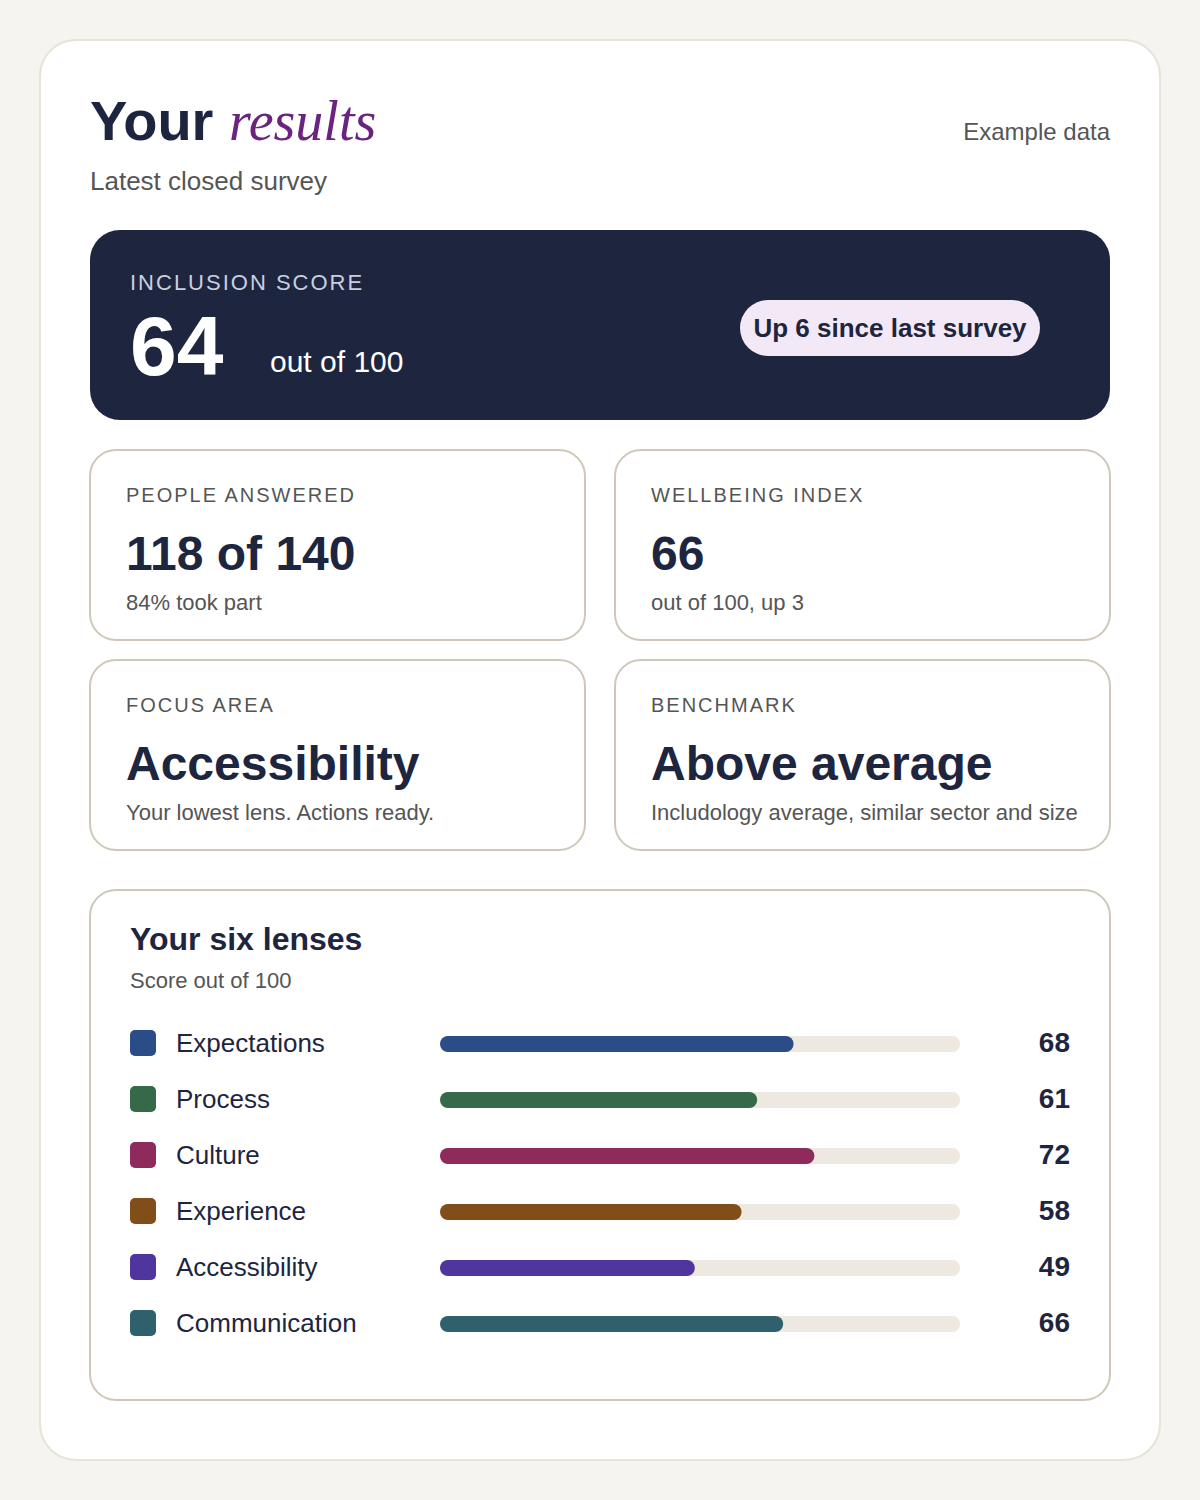
Six lenses, scored together as one system. Friction rarely sits in one place, so we never read them in isolation.
Expectations
What the organisation assumes of people, often unwritten and rarely the same for everyone.
Process
How work actually gets done: the steps, systems and approvals people have to move through.
Culture
The norms that decide what is safe to say, ask for, or challenge.
Experience
What day-to-day working life is actually like, rather than how it is described.
Accessibility
Whether the environment, tools and workplace can be used by the people in it.
Communication
How information moves, and where it stops, distorts, or never arrives.
How a cycle runs
Three stages, all run in the platform.
Diagnose
Leadership and employees each give their view, so you can see where assumptions and experience differ.
- Employee responses are anonymous and grouped. They are never linked to one person.
Map the friction
Each finding is traced back to a likely cause, so there is something to act on.
- The areas with the most friction come first.
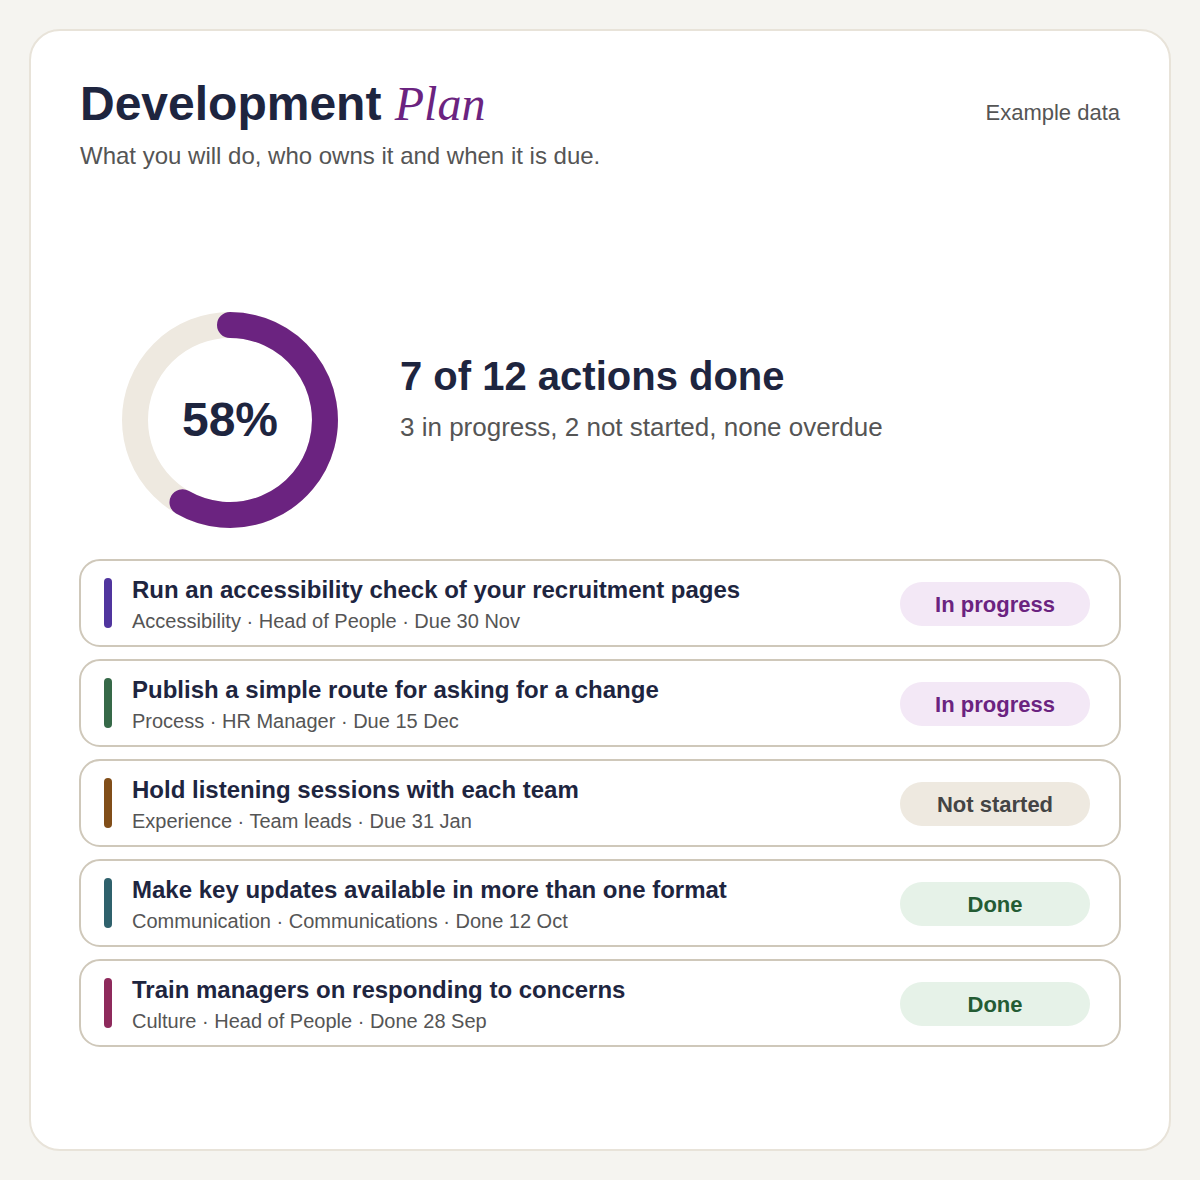
Act, with a plan
You get a prioritised plan based on your own results. Each action links to the finding behind it.
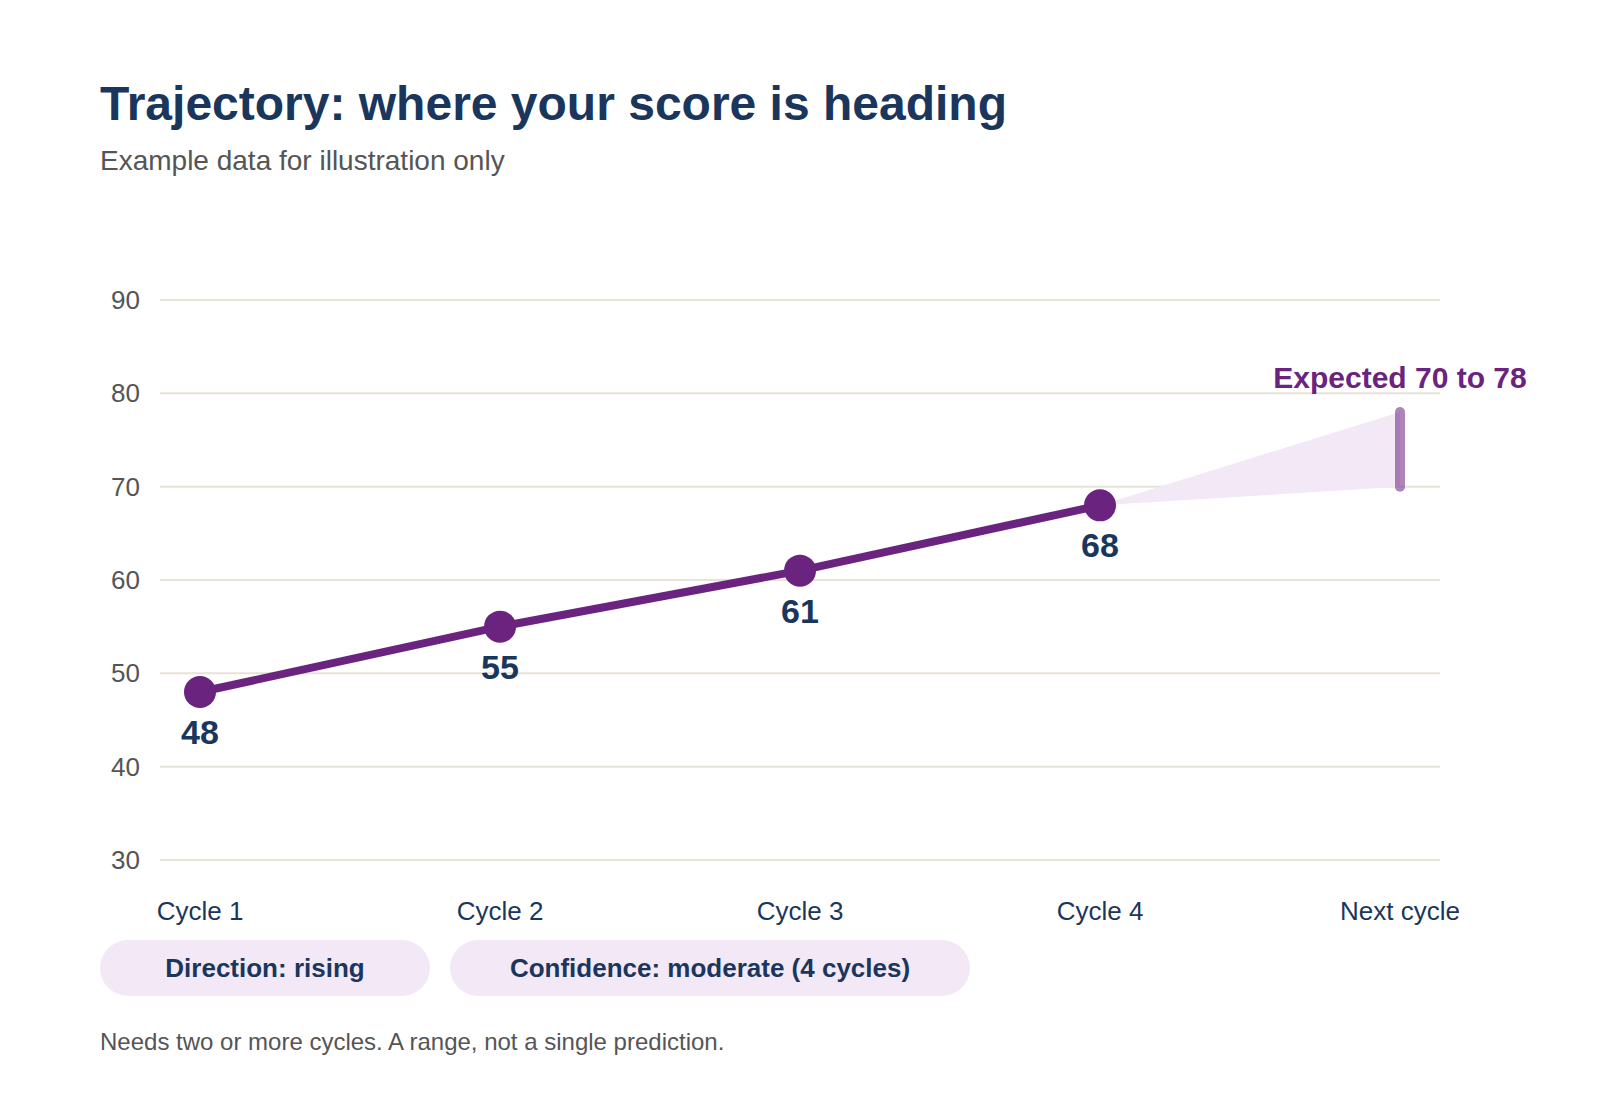
- You can track progress from one cycle to the next.
What the results look like
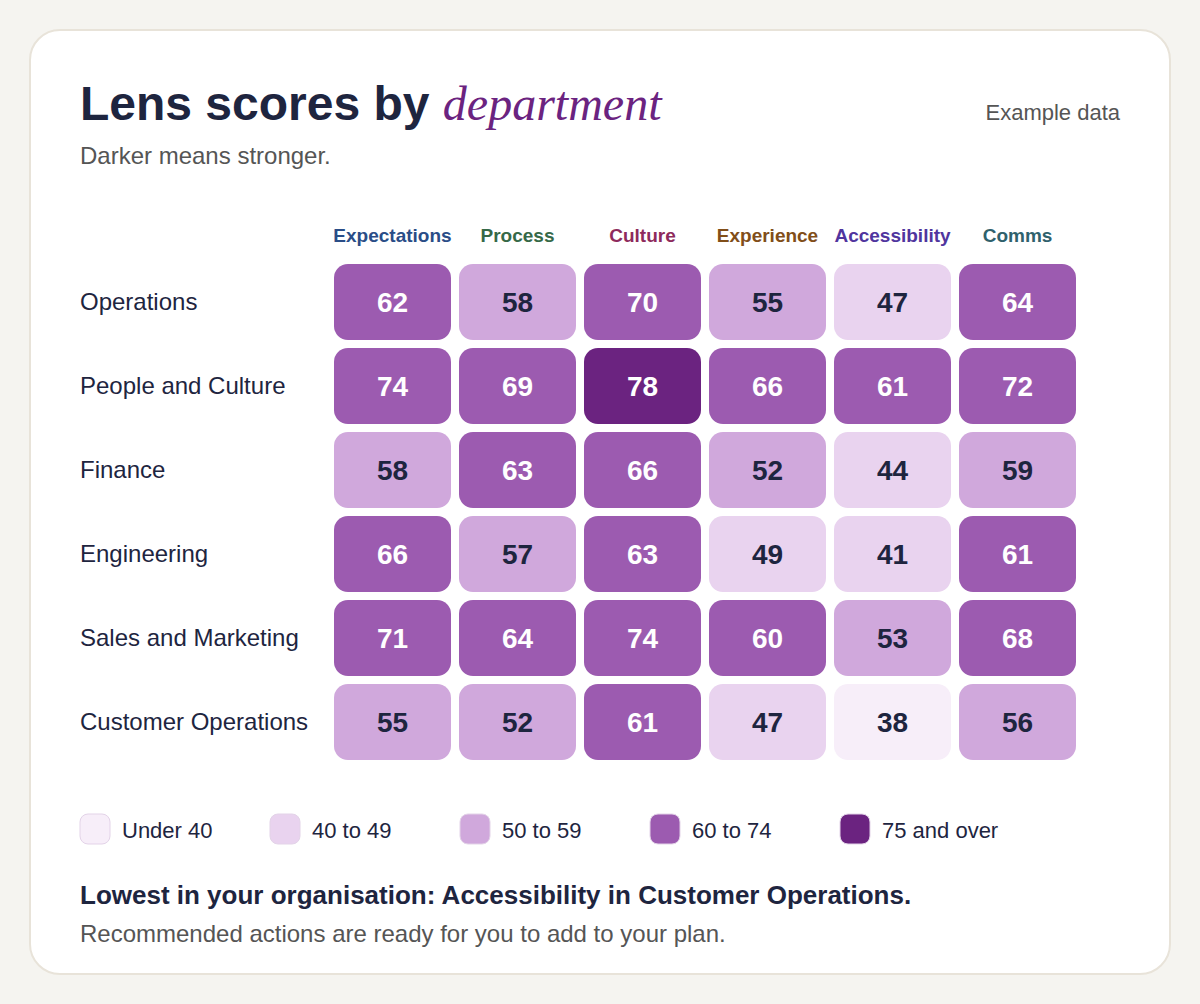
Lens scores by team
Tap any score to see what it means and what to do next.
- Under 40
- 40 to 49
- 50 to 59
- 60 to 74
- 75 and over
Customer Operations, Accessibility
This is where friction is most likely.
Next step: add the recommended actions to your Development Plan.
Scores are out of 100.
Six lenses at a glance
Tap a lens name or a dot to see what it means and what to do next.
Whole organisation, Accessibility
This is where friction is most likely.
Next step: add the recommended actions to your Development Plan.
Scores are out of 100.
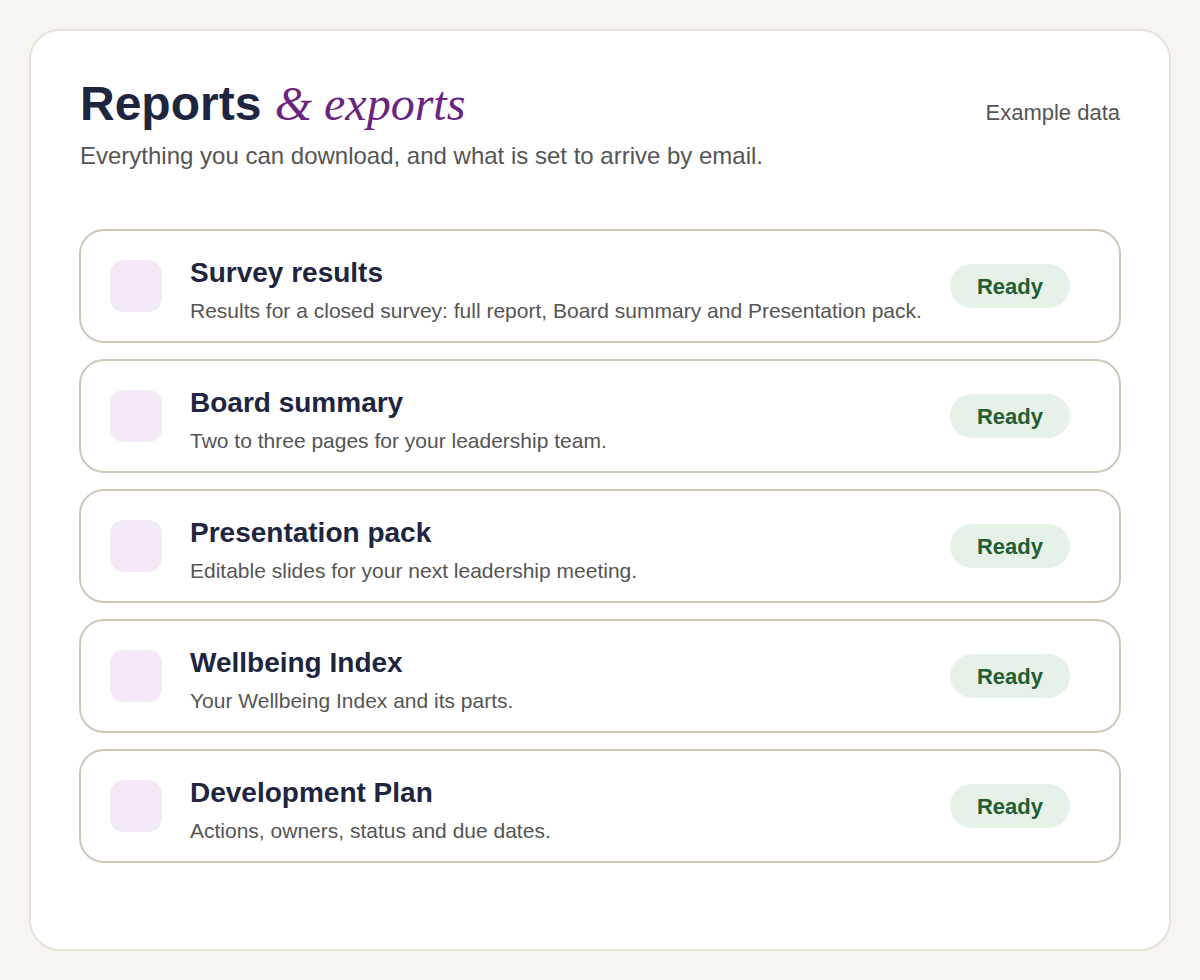
Who sees what, and who contributes
Leadership
Where the environment is costing you. Highest-friction lenses, the teams carrying the pressure, and movement cycle over cycle.
People teams
Findings you can act on, each paired with a recommendation.
Employees, as contributors
A short, anonymised contribution. Responses are grouped, never attributed, and employees don't get a results view.
Includology is in active development. The founding cohort shapes what gets built next.
The method is challenged by a panel of specialists
A panel of specialists reviews the framework and method.
See it run against your own environment.
Founding cohort places are open now. Enquire to find out more.